

This module is the most commonly use of SPSS Statistics .You can take the analytical process from start to finish with IBM SPSS Statistics Base. In addition to the data preparation, data management, output management and charting features now available in all IBM SPSS Statistics modules, IBM SPSS Statistics Base offers the most frequently used procedures for statistical analysis that are the foundation for many analyses. The procedures within IBM SPSS Statistics Base will enable you to get a quick look at your data, formulate hypotheses for additional testing, and then carry out a number of procedures to help clarify relationships between variables, create clusters, identify trends and make prediction.
SPSS Statistics Base gives you a wide range of satistical procedures for basic analysis, including counts, crosstabs, ANOVA, non-parametric test, t-test, descriptives, factor analysis,linear regression, cluster analysis, ordinal regression and nearest neighbor analysis. For more analytical power, use SPSS Statistics Base with other modules such as IBM SPSS Regression, IBM SPSS Direct Marketing, IBM SPSS Decision Tree, or other modules.
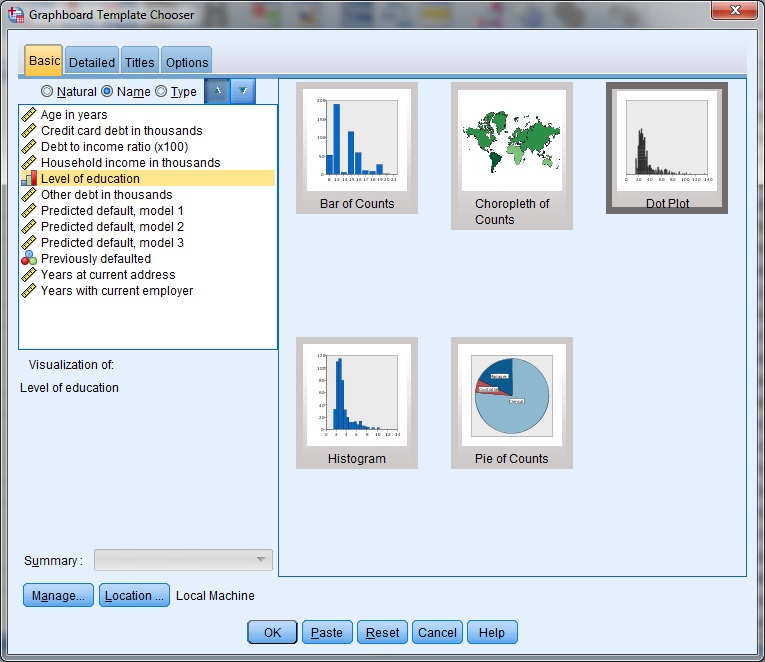
Graphboard feature :
Business Benefits
- Suppor t business decisions with data-based analytics for improved outcomes.
- Be more confident in your results by incorporating data from many dif ferent sources, including geospatial information, in your analysis and using proven, tested techniques to per form your analysis.
- Save time and ef for t with capabilities that enable experienced analysts to develop procedures or dialogs that others can use to speed through repetitive tasks.
- Give results greater impact by using visualization capabilities that clearly show others the significance of your findings.
You can contact us for more details.
 Telp. 021.750-2313
  Yahoo Messenger :